Game Wishlist to Sales Ratios, Benchmarks, Tiers, and Surprising Outliers
Discover how Steam wishlists actually convert into game sales. We analyzed hundreds of titles to uncover real conversion rates, industry benchmarks, and what impacts performance over 7 days and 1 month. Essential insights for game devs looking to boost sales.
Wishlists are a key metric that game developers try to build up as much as possible before launch, because wishlists are often seen as a strong predictor of sales.
The general belief is: the more wishlists you have, the more sales you’ll generate.
Many games invest significant time and resources into growing their wishlist counts—through influencers, advertising, social media, and PR. But are those wishlists actually worth it? And how do your conversion rates compare to industry standards?
At Glitch, we do marketing automation just for gaming and we are all about data analysis. Below is a comprehensive breakdown and analysis of how wishlists converted into sales for a dataset of 432 games launched on Steam between August and October 2024. All figures are aggregated, and no specific game names or identifying details are disclosed.
1. Overview of the Data
We took this data here from August, September and October 24 and analyzed it. Here is how it is broken down:
- Total games analyzed: 432
- Key metrics per game:
- Wishlists at launch
- Sales after 7 days
- Sales after 1 month
- Ratio of copies sold to wishlists (after 7 days and after 1 month)
Throughout this report, the term “conversion ratio” (or “ratio”) refers to:
Conversion Ratio (%) = (Copies Sold ÷ Wishlists at Launch) × 100
So for example:
Conversion Ratio = (1,000 ÷ 5,000) × 100 = 20%
Thus, a ratio of 50% means that at the time of measurement, sales were half the number of the game’s launch wishlists. A ratio of 200% means sales were double the number of wishlists, etc.
2. Conversion Ratio Tiers
After 7 Days
Each game’s 7-day ratio was assigned to one of the following tiers:
| 7-Day Ratio Tier | Number of Games | Percentage of Games |
|---|---|---|
| <1% | 15 | 3.47% |
| 1% to 5% | 94 | 21.76% |
| 5% to 10% | 100 | 23.15% |
| 10% to 25% | 114 | 26.39% |
| 25% to 49% | 50 | 11.57% |
| 50% to 99% | 41 | 9.49% |
| 100% to 199% | 11 | 2.55% |
| 200%+ | 7 | 1.62% |
Key Observations (7 Days)
- About 3.47% of games sold fewer than 1% of their wishlists within the first week.
- The largest single tier for 7-day performance is the 10% to 25% bracket, with 26.39% of games.
- A relatively small subset (4.17% in total) exceeded their wishlist count within the first 7 days (i.e., ratio >100%).
If you are thinking "where is my game likely to fall", 23.15% + 21.76% + 3.47% = 48.38%. So your most likely to have a less than 10% wishlist to sales conversion in the first 7 days of launch.
After 1 Month
The same tier definitions are applied to the 1-month ratio:

| 1-Month Ratio Tier | Number of Games | Percentage of Games |
|---|---|---|
| <1% | 10 | 2.31% |
| 1% to 5% | 76 | 17.59% |
| 5% to 10% | 73 | 16.90% |
| 10% to 25% | 121 | 28.01% |
| 25% to 49% | 69 | 15.97% |
| 50% to 99% | 44 | 10.19% |
| 100% to 199% | 25 | 5.79% |
| 200%+ | 14 | 3.24% |
Key Observations (1 Month)
- 2.31% of titles still had under 1% conversion even after a month, slightly lower than the 3.47% at 7 days.
- 28.01% of games landed in the 10% to 25% tier, making it the largest category at 1 month as well.
- More games (9.03%) surpassed 100% of wishlists by the one-month mark, more than double the share at the 7-day mark (4.17%).
Now here is where things can look more positive for game! After the period of one month, more wishlists converted into sales. With 2.31% + 17.59%+ 16.90% = 36.8% chance that your game will have less than 10% conversion. With 28.01% + 15.97% = 43.98% chance that 10% to 50% of your games wishlist will have converted to sales.
3. Sales vs. Wishlists
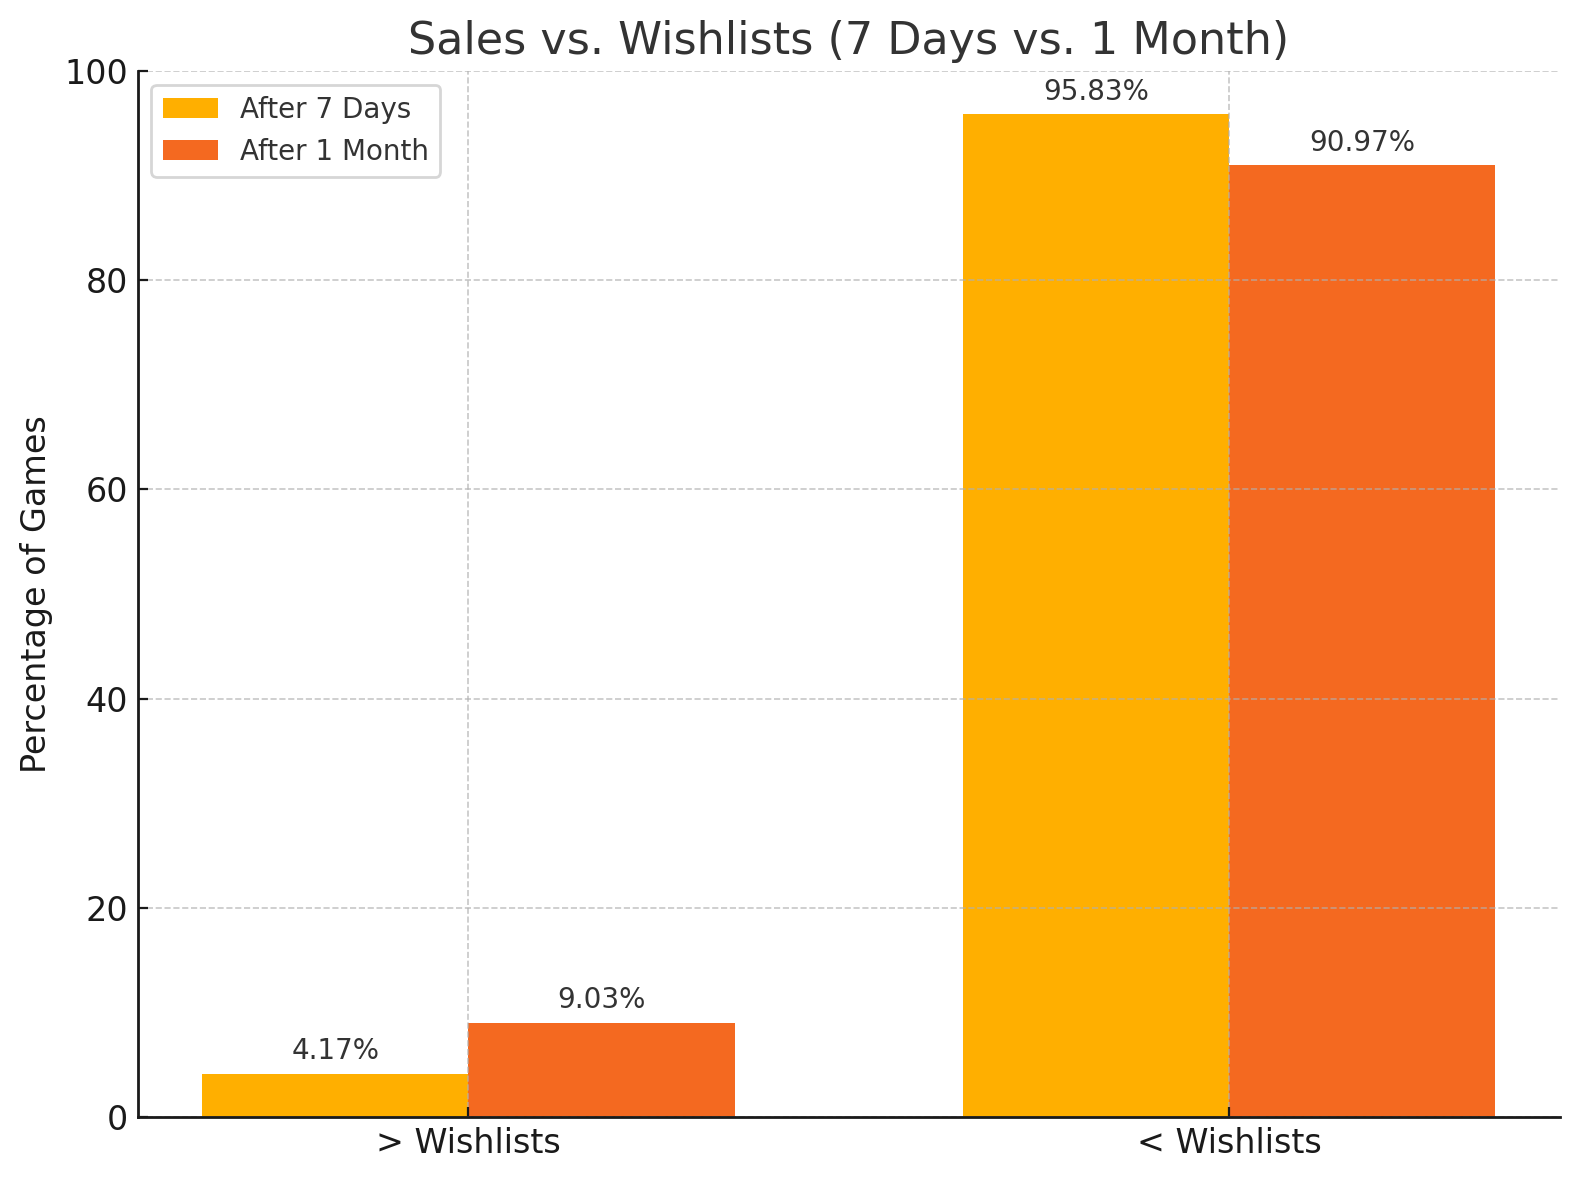
Games with Sales Greater Than Wishlists
- After 7 days: Approximately 4.17% of games had sales higher than their total launch wishlists.
- After 1 month: That figure rose to 9.03%, indicating that nearly one in ten games ended up selling more copies than their original wishlist count within a month of release.
Games with Sales Less Than Wishlists
- After 7 days: About 95.83% of games sold fewer copies than their wishlist count.
- After 1 month: This dropped to 90.97%, reflecting that some games caught up to or surpassed wishlist totals during weeks two to four post-launch.
4. Wishlists Growth & Ratio Changes Over Time
Percentage Increase in Conversion Ratios from 7 Days to 1 Month
To quantify how a game’s conversion ratio evolved from the first week to the first month, we calculated:
% Increase = ((Ratio_1m / Ratio_7d) - 1) × 100%
For example:
% Increase = ((31 / 20) - 1) × 100% = 55%
With all the data we found that:
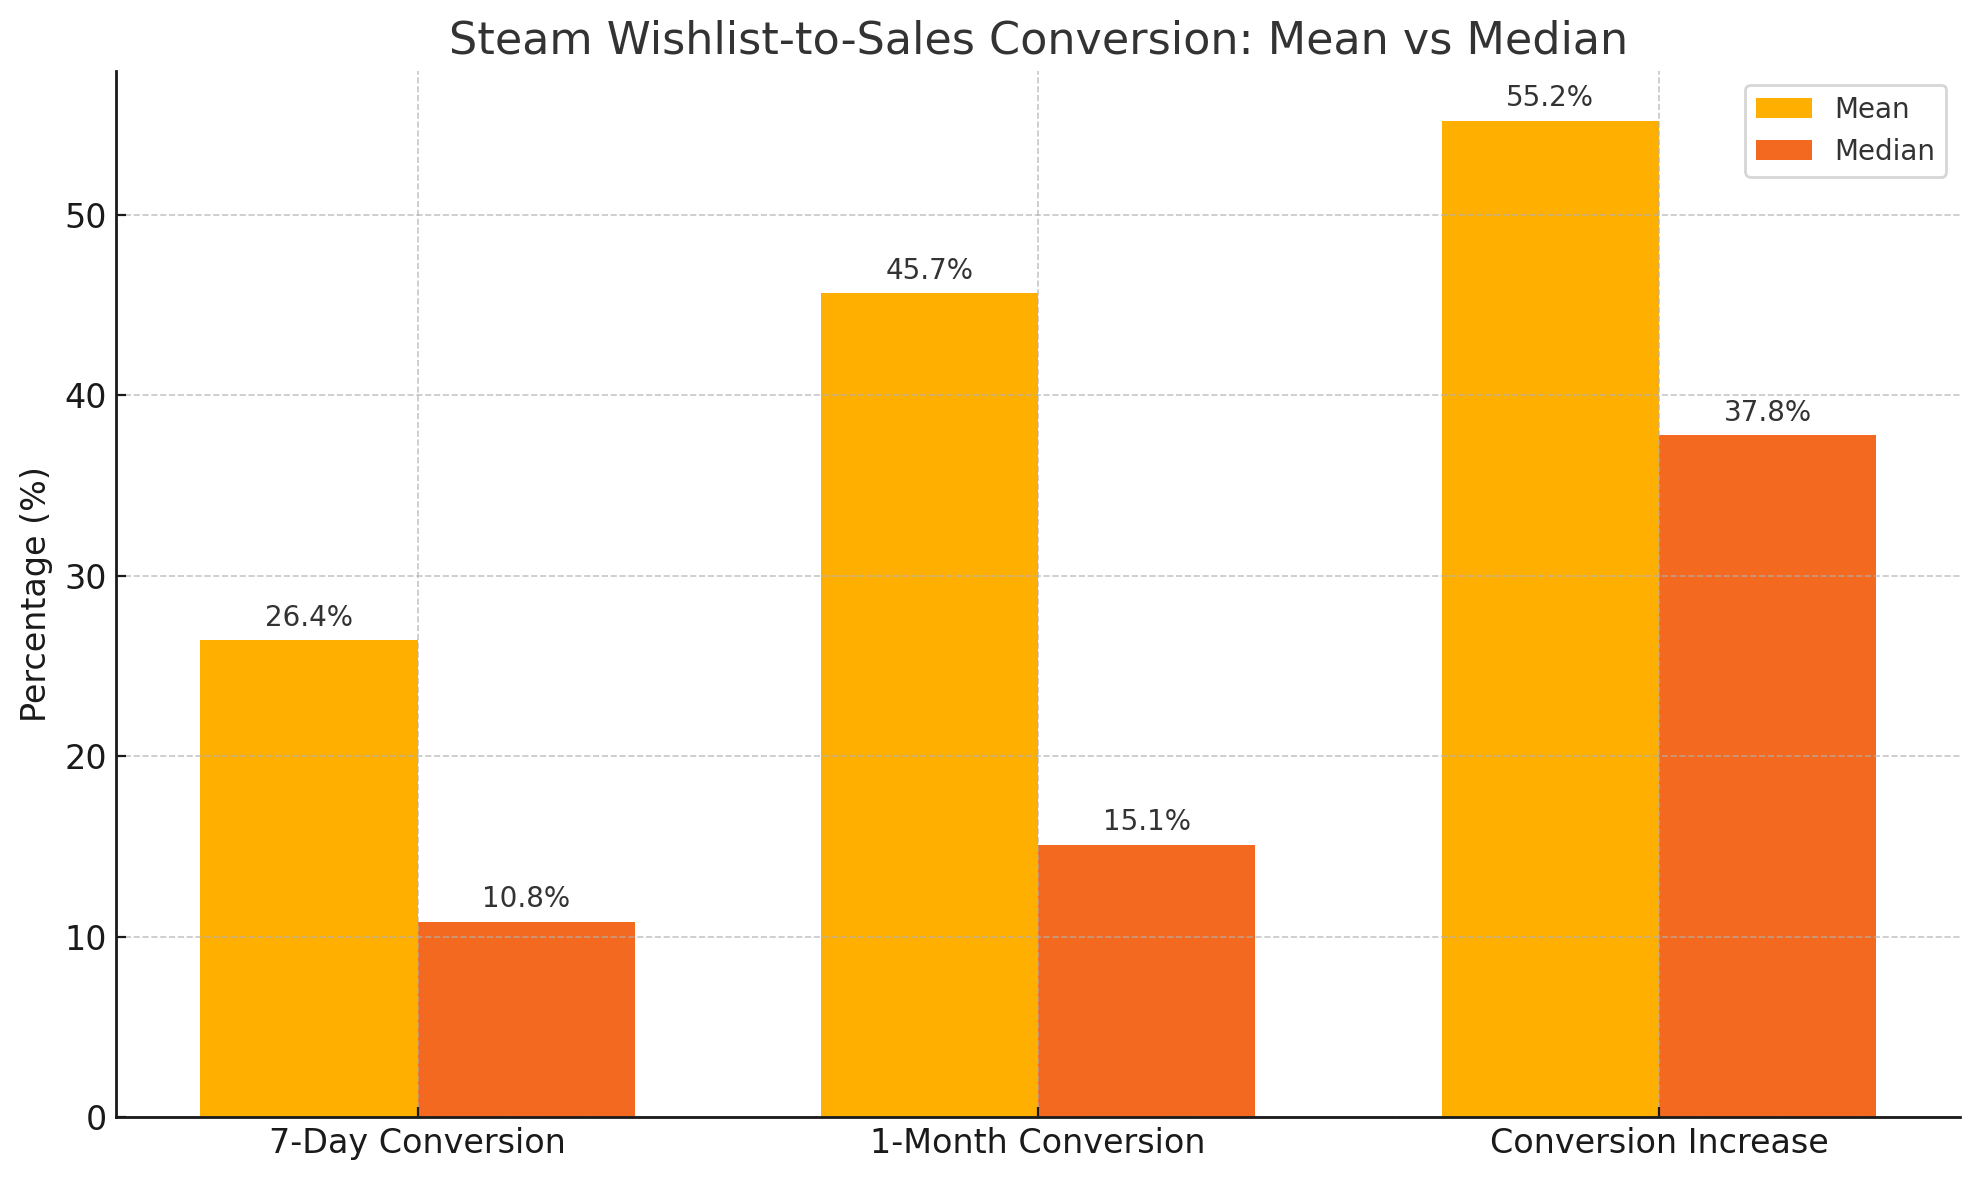
- Average increase: +55.23%
- Median increase: +37.79%
In other words, if a game’s 7-day ratio was 20%, on average it might be around 31%–33% by the 1-month mark (because a ~55% increase applied to 20% yields ~31%). The median number of +37.79% suggests that half of games saw at least a ~38% jump from the first week’s ratio to the end of the month, while the other half saw less.
Absolute Conversion Ratios
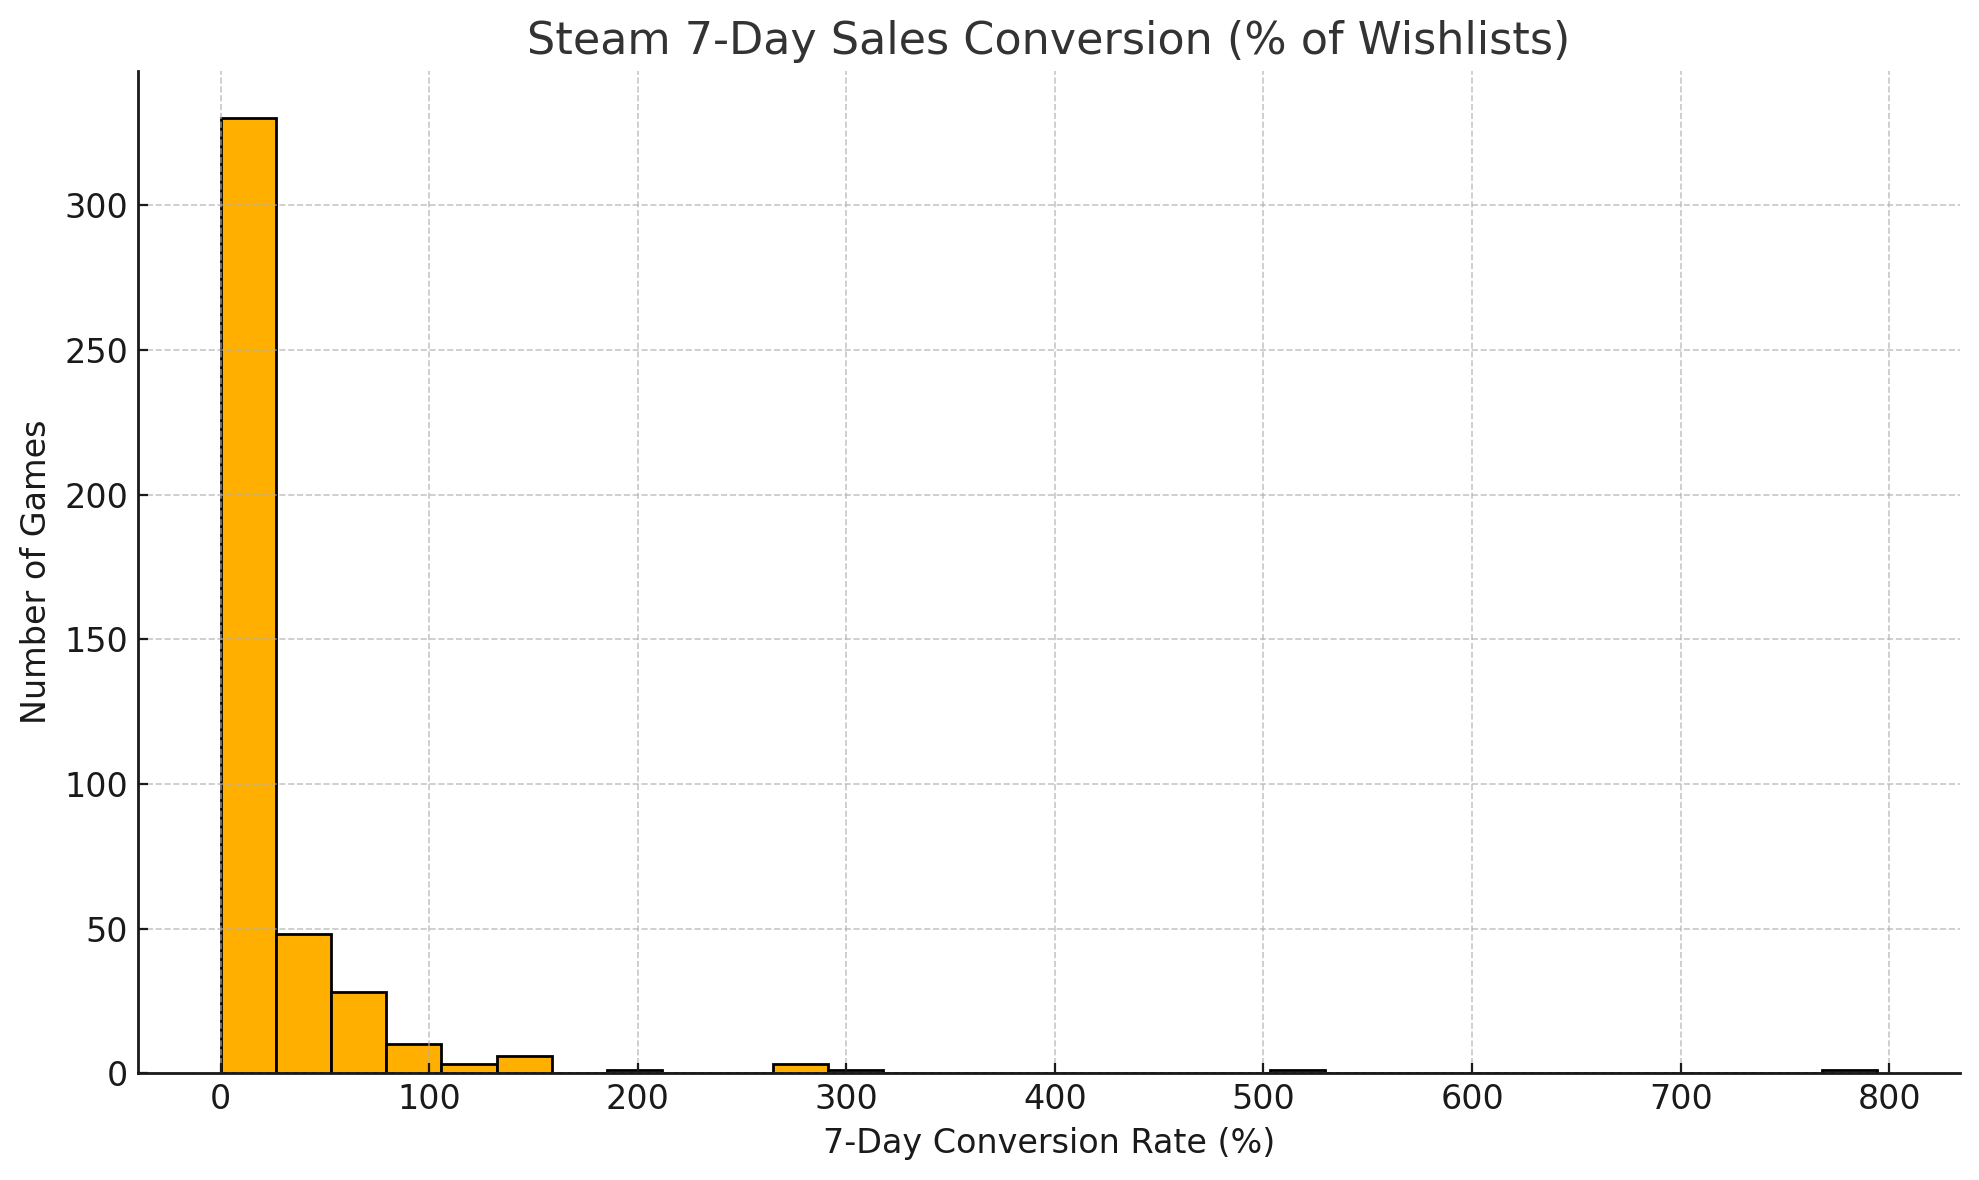
- Mean 7-day ratio: 26.43%
- Median 7-day ratio: 10.83%
- Mean 1-month ratio: 45.68%
- Median 1-month ratio: 15.10%
The disparity between mean and median highlights a skewed distribution, where a small number of extremely high-performing titles elevate the mean. Many games remain in significantly lower ratio brackets (reflected by the lower median).
Outliers
- Minimum ratio at 7 days: 0.01% (a game that generated extremely low initial sales compared to its wishlist base)
- Maximum ratio at 7 days: 794.23% (one title sold nearly 8 times its wishlist count in the first week)
- Maximum ratio at 1 month: 2737.49% (a major outlier where the game sold over 27 times its wishlist base within a month)
These outliers reinforce the idea that while most games cluster in lower percentage tiers, a handful can drastically outperform their wishlist numbers.
So What Does All This Mean For Your Game?
Data, numbers, chart analysis, but the bottom line is what does all this mean for my game? It means that the first 7 days of your games launch might not look to good as less than 10% of your wishlist will convert to wishlist.
But hold strong because over the course of the first month you can get up to a 50% conversion. Titles with relatively modest 7-day ratios but high 1-month ratios hint at effective ongoing marketing, updates, or word-of-mouth factors that can drive sales well after release week.
Overall, while many games struggle to convert even a quarter of their wishlist base within a month, a noteworthy fraction (9%) do surpass their own wishlist numbers. The data suggests that continued attention and improvements after launch can be pivotal in translating wishlists into sales over time.
Need Help Understanding Your Game's Data?
Data can be complicated, time consuming and confusing. We have released an AI Marketing assistant that will help you understand your games and make actionable decisions.
It tailors all responses specifically for your game and help you execute influencer campaigns, social media automation and so much more!